If you’ve ever stared at an Excel spreadsheet wondering how reliable your data really is, you’re not alone. That’s where standard error comes in. Knowing how to calculate standard error in Excel helps you understand how much your sample mean might vary—and it’s a must-have skill for students, researchers, and anyone working with data.
In this guide, we’ll break it all down in plain English. You’ll learn how to calculate standard error, how it connects to charts, and how to add error bars in Excel, whether you’re on Windows, Mac, or Excel Online.
What Is Standard Error (And Why It Matters)
Standard error (SE) measures how accurately a sample mean represents the true population mean. In simpler terms, it tells you how much “wiggle room” there is in your average.
A smaller standard error means:
-
Your data is more precise
-
Your mean is more reliable
-
Your conclusions are stronger
This is why standard error is often used when creating charts with error bars in Excel.
The Standard Error Formula Explained Simply
Before jumping into Excel, it helps to know what’s happening behind the scenes.
Standard Error Formula:
Standard Error = Standard Deviation ÷ √(Sample Size)
You need two things:
-
Standard deviation
-
Number of observations
The good news? Excel handles the math for you.
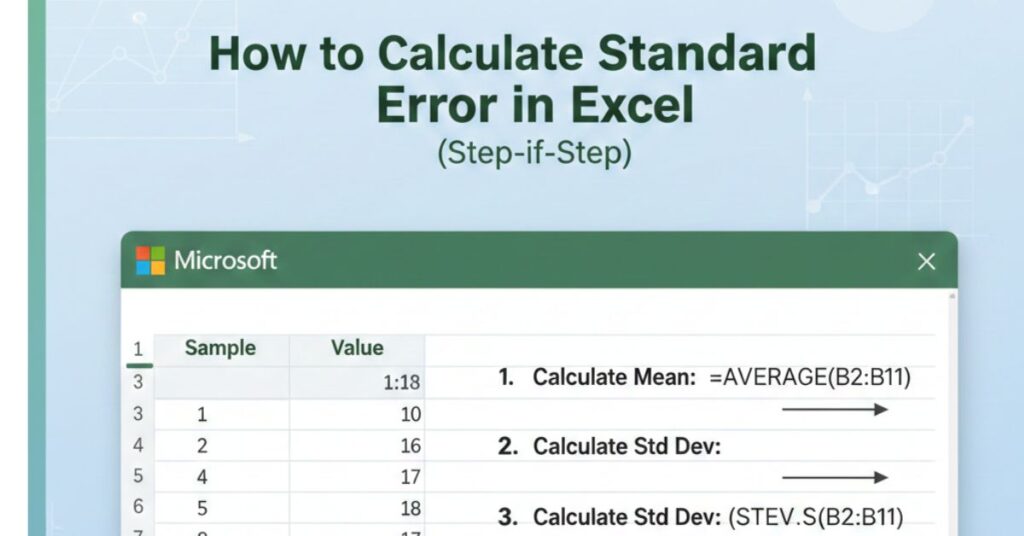
How to Calculate Standard Error in Excel (Step-by-Step)
Step 1: Enter Your Data
Place your numerical data into a single column. For example:
Step 2: Calculate the Standard Deviation
Use one of these formulas:
-
For a sample (most common):
-
For a population:
Step 3: Calculate the Sample Size
Step 4: Calculate Standard Error
Now divide the standard deviation by the square root of the sample size:
That’s it—you’ve just calculated standard error in Excel
How Standard Error Connects to Error Bars in Excel
Once you have standard error, you can visualize it using error bars in charts. This is where many users get stuck, especially across different Excel versions.
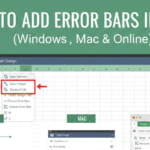
How to Add Error Bars in Excel (Windows)
If you’re using Excel on Windows, follow these steps:
-
Select your chart
-
Click the Chart Elements (+) icon
-
Check Error Bars
-
Choose More Options
-
Select Custom → Specify Value
-
Enter your standard error value
This method works perfectly when you’re showing variability based on standard error.
How to Add Error Bars in Excel on Mac
The process on Mac is slightly different but just as straightforward:
-
Click on your chart
-
Go to Chart Design → Add Chart Element
-
Select Error Bars → More Error Bar Options
-
Choose Custom and input your values
If you’re searching specifically for how to add error bars in Excel Mac, this is the cleanest approach.
How to Add Error Bars in Excel Online
Excel Online has fewer features, but it still gets the job done.
To add error bars in Excel online:
-
Select your chart
-
Open Chart Options
-
Enable error bars (if available)
-
Note: Custom standard error values may require opening the file in the desktop version.
Common Mistakes to Avoid
When calculating standard error in Excel, watch out for these:
-
Using STDEV.P instead of STDEV.S for sample data
-
Forgetting to divide by the square root of sample size
-
Confusing standard deviation with standard error
-
Adding error bars without explaining what they represent
These small errors can lead to big misinterpretations.
FAQs: Standard Error and Excel
What’s the difference between standard deviation and standard error?
Standard deviation measures data spread, while standard error measures the precision of the sample mean.
Can Excel calculate standard error automatically?
No, but Excel makes it easy with built-in formulas.
Is standard error the same as confidence intervals?
No, but standard error is used to calculate confidence intervals.
How do I add error bars in Excel Online?
You can enable basic error bars, but custom standard error values work best in desktop Excel.
Should I use standard error or standard deviation for error bars?
Use standard error when you want to show how accurate the mean is.
Conclusion: Take Control of Your Data in Excel
Once you understand how to calculate standard error in Excel, your data analysis becomes more powerful and more trustworthy. Pairing standard error with properly added error bars in Excel helps your charts tell a clearer, more honest story.
If you’re ready to go deeper, consider exploring:
-
Confidence intervals in Excel
-
Statistical charts and visualization best practices
-
Advanced Excel formulas for data analysis